October 2024 Newsletter
As we move through the fall, we would like to cheer on the many dedicated FieldScope data collectors. From May through September of this year, over 32,000 observations were logged by the active projects on FieldScope! There is exciting work being done by participatory scientists, grassroots organizations, and formal and informal educators. We hope this newsletter will provide some useful information about upcoming events, current projects, and visualizing data in FieldScope. Happy fall!
EVENTS
The FieldScope team will be at NAAEE and AAPS! Check out details below.
North American Association for Environmental Education (NAAEE)
November 6-9, Pittsburgh
Learn about how FieldScope can be used to store and visualize environmental data and support science education and community inquiry. Stop by our booth or attend our workshop on Friday, November 8, 2024 from 2:15-3:45 p.m., featuring scientists and educators from the TickTalk Project. Learn more about this project below.
Association for Advancing Participatory Sciences (AAPS)
May 27-30, Portland
Learn how to use the FieldScope platform when engaging in data inquiry! Details TBA!
PROJECT SPOTLIGHT
Tick Talk
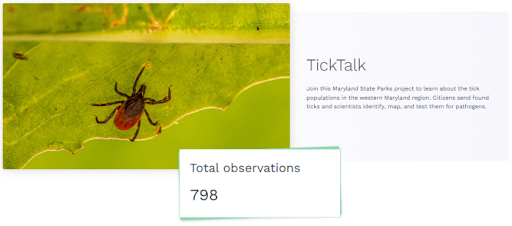
The idea for turning TickTalk into a FieldScope project started like many pandemic-era efforts, in a Zoom breakout room. Sarah Milbourne, Western Region Manager for Maryland Park Service, and Jessica Bean, Director of Outreach and Science for FieldScope, were attending an online climate education conference. Sarah started talking about the need to connect inland, rural communities–where issues like sea level rise do not seem as immediate and relevant–with local issues and regional data that are connected to climate change adaptation and mitigation. Thinking about local sources of data, Sarah remembered seeing a presentation by Dr. Rebekah Taylor at Frostburg University who started a project tracking Lyme disease in local ticks after her son unexpectedly contracted the disease from a bite during a camping trip. Growing up in western Maryland, Rebekah never had to worry about ticks and Lyme disease, but climate change has created opportunities for ticks to migrate west as precipitation increases and the annual number of frozen days decreases. Fortunately, Rebekah’s son recovered, but the experience inspired her to learn more about ticks in the region. In 2017, Rebekah and her students started collecting, analyzing, and crowdsourcing ticks from the public to understand the local prevalence of Lyme disease, and Rebekah wanted to make these data public to help inform communities about the dangers of ticks and Lyme disease.
FieldScope is honored to be the home of TickTalk’s growing database, which will be central to the design of new formal and informal educational resources developed in collaboration with Rocky Gap State Park and the FieldScope team.
TickTalk was the subject of an article in The Washington Post earlier this year, and the project data will be explored with participants at our NAAEE workshop in November!
BECOMING FIELDSCOPE SAVVY – FEATURING SOME OLD FAVORITES
A Deep Dive into Including/Excluding Data in a Filtered Set
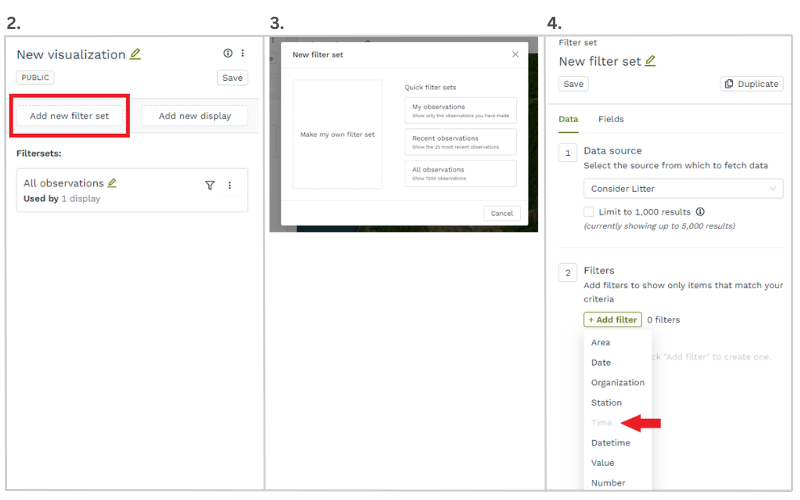
When creating FieldScope visualizations, you may want to use only specific parts of a full data set, and the platform accommodates filtering data in numerous ways. Here is a quick rundown on how to filter to include or exclude values used in visualizations. If you would like to learn more about filtering, check out the article! 1.) Click the “Visualizations” tab and then “Create new.”2.) In this new visualization screen, click on “Add new filter set.” 3.) A pop-up box will give you the option to use one of the quick filter sets: “my observations,” which are observations you contributed to the project, “25 most recent observations,” or “all observations.” (Note that when you select “all observations,” the platform will show you a maximum of 1,000 even though there may be more observations available. You can increase this cap to 5,000 observations by removing the checkbox. Selecting “Make my own filter set” will allow you to customize your own filtered set of data. 4.) Click “Add filter” and you will see that many types of filters are available to choose from. Data may be filtered to show only those data in a particular area, logged during a particular date range or during certain times, by a certain organization, at a certain station (data collection location), or only data reflecting certain values and numbers. Any filter type that is not available (if it is not a parameter of data collected in the project), will be grayed out.
5.) Any project utilizing categorical fields–a dropdown menu of options (example: a field titled “Salmon species” with a dropdown menu of options for “Chinook” or “Steelhead”)–or open text fields will include the option to filter by value. 6.) Once you select the field you would like to use as a filter, you can use the option “Any of these values” and choose the values in the dropdown menu that you would like to see in a visualization.7.) Multiple values may be selected.
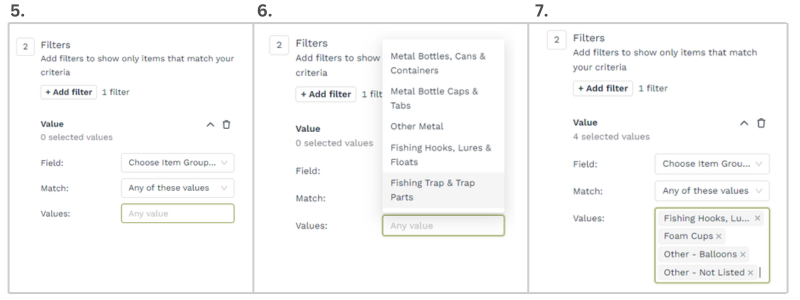
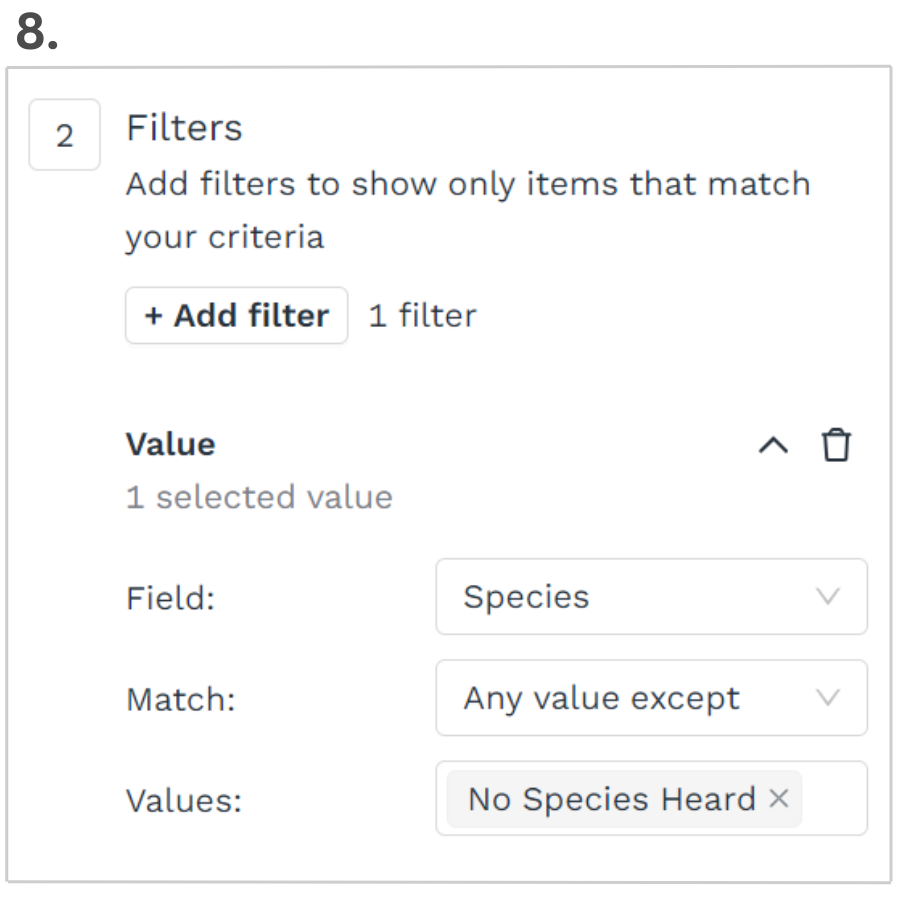
8.) If you would like to exclude values from your filter set, choose “Any value except” and select the values you do not want to see. In this example, the data are filtered to include all studied species. Instances of data collection when no species were heard have been excluded.
Feel free to reach out to the FieldScope team at info@fieldscope.org if you have any questions about filtering!
Do you have a new feature request for the FieldScope team? Reach out and let us know! While we are not always able to accommodate requests, we love to hear your ideas and, over time, they help us improve our platform.